Features
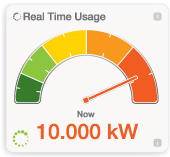
Real-time Usage - See your current power usage instantly
Instant energy information is key to successful home energy management, after all you can't save what you can't see! Choose from four different widget styles to find the widget that suits you.
Example
Are you worried that you might have left and appliance on when you left home, or maybe you want to make sure the kids aren't leaving all the lights on when you're at work? This feature allows you to view what is happening right at the moment.
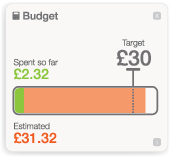
Budget - Set a target and accurately track your performance against it
A great was to save money is planning a budget. This feature lets you set your own monthly target and will show you exactly where you are in relation to that. It's a great way to help you keep on track with your personal energy saving goals.
Example
Do you like the idea of planning how much to spend on your utility bills each month but find it difficult to track where you are against your target? Use this tool to carry our the hard work for you, allowing you to concentrate on how to better spend the money you save.
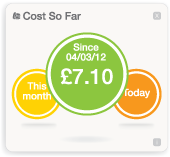
Cost So Far - Discover how much you have spent in real-time
This widget helps you monitor your consumption and accurately see how much you have spent so far. You can choose to see what you have spent so far today, this week, this month or from a date of your choice.
Example
Keep up-to-date on your energy costs and avoid the energy bill "shock effect" at the end of the month.
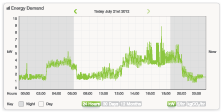
Energy Demand - Gain a broader understanding of your power demand
If you want a greater overview of the power you demand from the grid this handy graph records and displays the peaks and troughs over the last 24 hours See when and how you consumed electricity and exactly how much power it demanded from the grid.
Example
Review the last 24 hours to see when you use energy the most within your home or office. If you are charged peak rates at certain times of the day by your supplier use the Energy Demand widget to make sure you are not unnecessarily using energy during these peak periods.
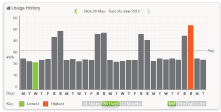
Usage History - See the amount of energy consumed per day and month
Use the alternative view of the Energy Demand graph to see how much energy you have used every day over the last month. You can also track how much you have used per month for the last year and how much your consumption behaviour is costing you.
Example
Do you feel you are managing your energy use well but cannot prove it nor see when and why you get those suprisingly large bills at the end of the month? Go back in time with the Usage History widget adn learn how to get your energy usage to follow a downward trend.